
BFCM 2025 is officially wrapped, and merchants crushed it!
You kept sites steady. Checkout fast. Operations moving. And it showed. ShipperHQ BFCM 2025 data from thousands of merchants shows:
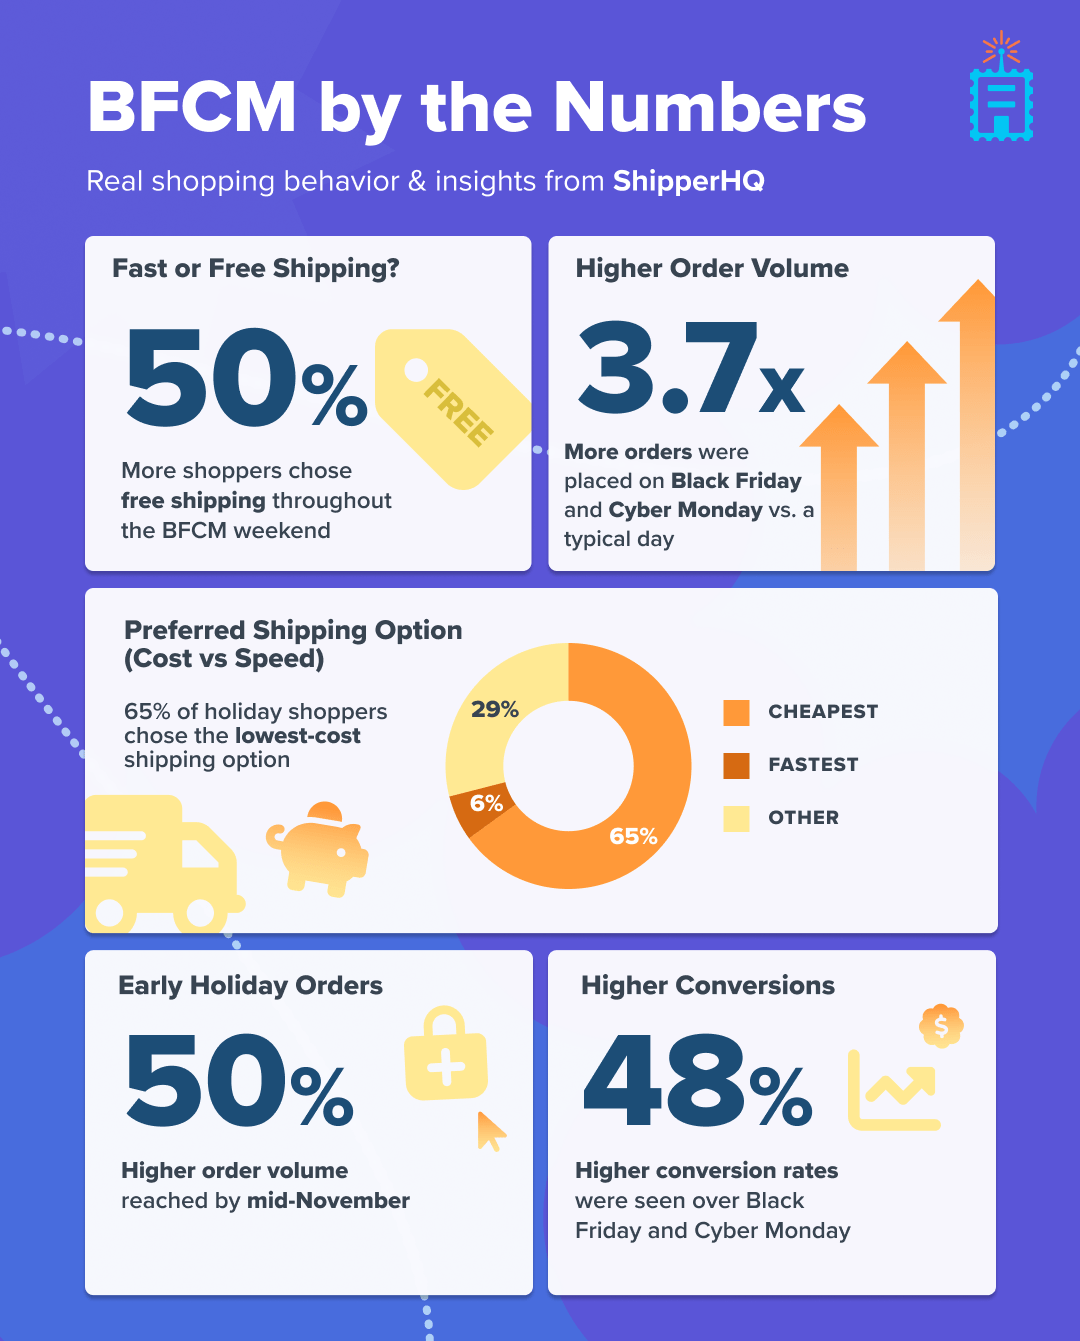
- Orders rose 50-60% in early November (compared to a typical day in October)
- During BFCM, orders surged to 3.7X standard order volume
- Conversion rates climbed 48% over non-BFCM conversion rates
- Free shipping was selected 50% more than usual
Peak season isn’t a weekend event anymore. It now starts in early November and runs through the holidays, with BFCM sitting squarely in the middle of it. The merchants that saw strong performance through this first major surge are the ones best positioned to win the rest of the season.
Read on for a full recap of BFCM 2025 shopper behavior, shipping preferences, and what these trends mean as you close out the holiday season and gear up for 2026.
1. Shoppers Drove 3.7x More Orders on BFCM
BFCM is still the biggest revenue opportunity of the year. Orders surged 3.7X the typical non-BFCM volume – and the surge hit fast.
Traffic, rate calls, and checkouts peaked at 11 AM EST on Black Friday – 1 hour earlier than last year. The stores that remained stable, even as traffic and operations peaked, were the ones who prioritized resilient infrastructure, prepped and tested it early, set up backup carriers, and monitored real-time performance closely. Their shipping and checkout engines were fast, predictable, resilient, and battle-tested long before November arrived.
Takeaway:
BFCM is still the crown jewel of eCommerce revenue. This year, it delivered nearly a 4x surge in orders that rewarded merchants whose online storefronts and backend operations were built to stay resilient under pressure.
2. November Orders Jumped 50% – Peak Season Starts Earlier
Increased demand kicked off even earlier than last year: Orders ran 50% above normal throughout early and mid-November. That’s 25% higher traffic in November 2025 compared to the previous year. There’s no denying the trend: Peak season isn’t just a long weekend anymore, it’s a months-long operational marathon.
Top-performing merchants adjusted their entire calendar. They locked in carrier capacity early, tested rates and shipping rules ahead of time, and staffed up fulfillment teams long before demand hit at the beginning of November.
Takeaway:
The peak season timeline keeps shifting up. Use Q1 2026 for post-mortem analysis and strategy. In Q2, focus on operational build and optimization. By September, you want everything buttoned up and ready to go.
3. Conversion Rates Jumped: 48% on BFCM and 20% in Early November
BFCM 2025 shoppers showed up ready to buy. But urgency only converts when checkout is fast, smooth, and friction-free. Shipping can be a reason for abandonment if costs are too high or delivery is too slow.
Winning merchants delivered:
- Instant, cost-effective shipping rates
- Smart free shipping offers
- Fast, accurate delivery timelines
Affordability mattered most to shoppers in 2025: 67% of shoppers chose the lowest-cost shipping option, reinforcing that cost still outranks delivery speed unless timing is critical.
Takeaway:
BFCM is a time to take advantage of higher-than-usual conversion rates. Make the most of it by ensuring your shipping and checkout experience is reliable and optimized for conversion.
4. Free Shipping was Chosen 50% More During BFCM
Free shipping made up 58% of Black Friday orders – up from 45% during BFCM 2024 – and was chosen 50% more often than on a typical day. But while shoppers expect it, offering it across-the-board can hurt margins. Instead, many merchants offer free shipping only under certain conditions, such as:
- Order value above a free shipping threshold to lift AOV (like free shipping on all orders over $200)
- Margin-friendly SKUs or product groups, like low-cost or high-turnover products
- On everything except oversized or expensive-to-ship items
Takeaway:
Free shipping is an essential strategic lever to drive sales, but depending on your margins, you may choose to offer it only when certain conditions apply – and when it makes sense for your bottom line.
5. In-Store Pickup Dipped, but May Rise in December
During BFCM, In-store pickup saw a slight dip during BFCM compared to other months.
But that trend could be temporary. As the holidays near, shoppers may focus more on getting the order on time. BOPIS becomes an essential option, especially for last-minute shoppers.
Takeaway:
Pickup tends to matter more in December as shipping deadlines approach. Make sure your In-Store pickup functionality is ready to handle December orders.
Finish the Season Strong
This season made one thing clear: marketing brings shoppers in, but the shipping and checkout experience determine who actually captures the sale.
The strongest brands ensured continuous uptime, served up instantaneous and cost-effective shipping rates, promoted smart free shipping offers, and provided fast, transparent delivery dates.
As you move through the rest of December and into 2026, the message is simple:
Make sure your infrastructure is resilient and battle-tested, your shipping options meet customer expectations, your delivery promises are accurate, and your checkout is friction-free.
Peak season is no longer a weekend sprint – it’s a long, early, high-pressure stretch that rewards merchants who prioritize resilience and customer experience. The teams that treat shipping and checkout as core infrastructure – not fire drills – will carry the most momentum into the new year.
Want to see how your checkout experience compares to the industry leaders? Schedule a demo with our team – we’ll show you what’s working best for your industry, and help you create the perfect shipping and checkout experience for your business.

")

